Replaying disequilibrium populations
The paper shows fine-grained replays for three replicates that were experiencing adaptive momentum (one that failed to cross, one that crossed one valley, and one that crossed two valleys).
Prior to these fine-grained replays, we replayed 24 populations at with less precision.
We replayed every fourth generation with 1,000 replicates per replay (compared to 10,000 replicates for every generation in the fine-grained replays).
Here we show all 24 coarse-grained replays.
The functions to generate the plots are not shown here.
They can be viewed in /experiments/2024_03_18_01__replays/analysis
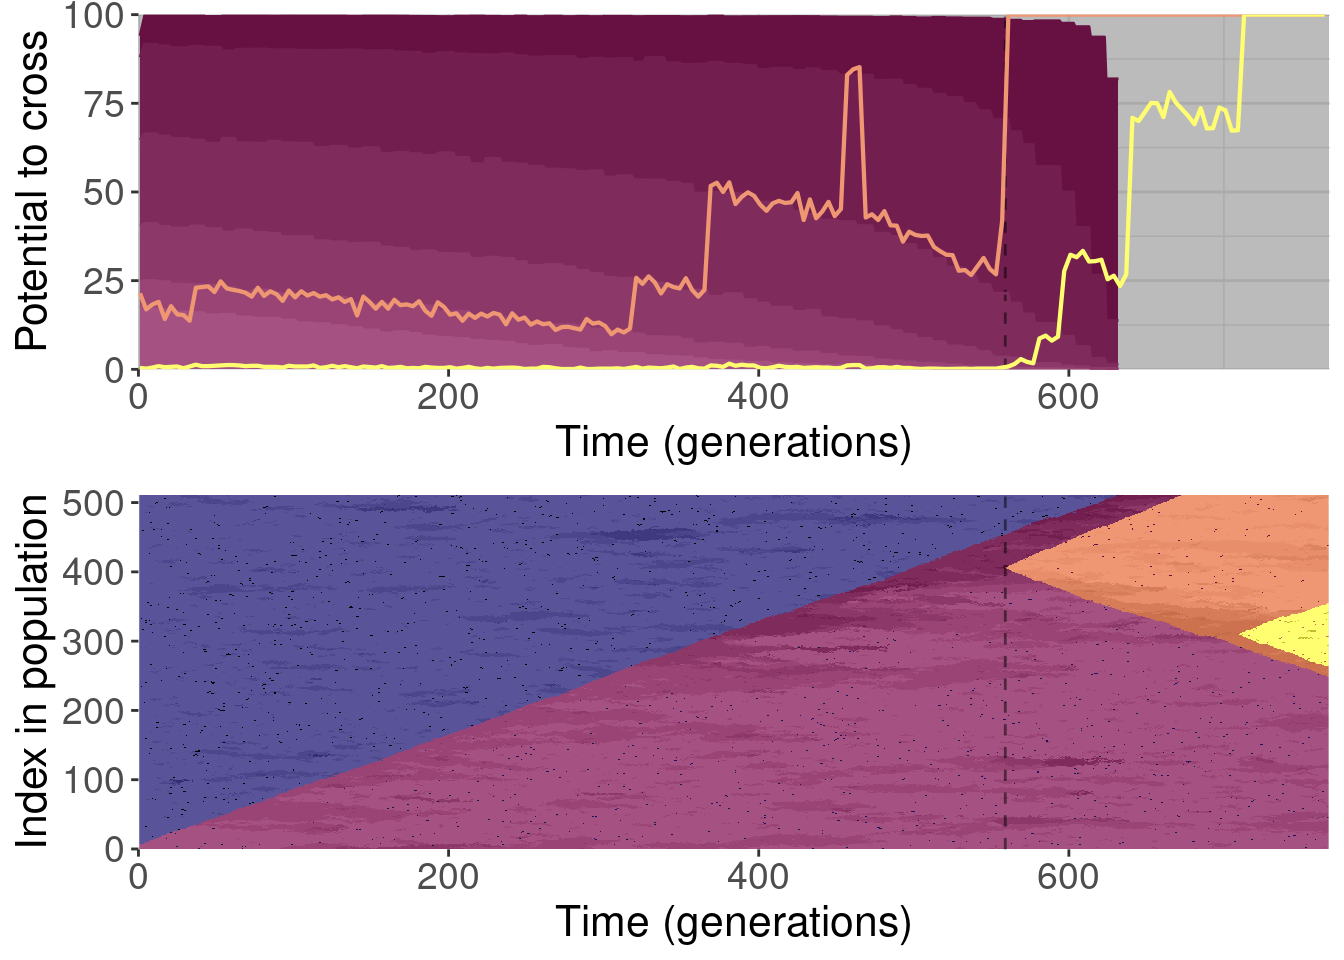
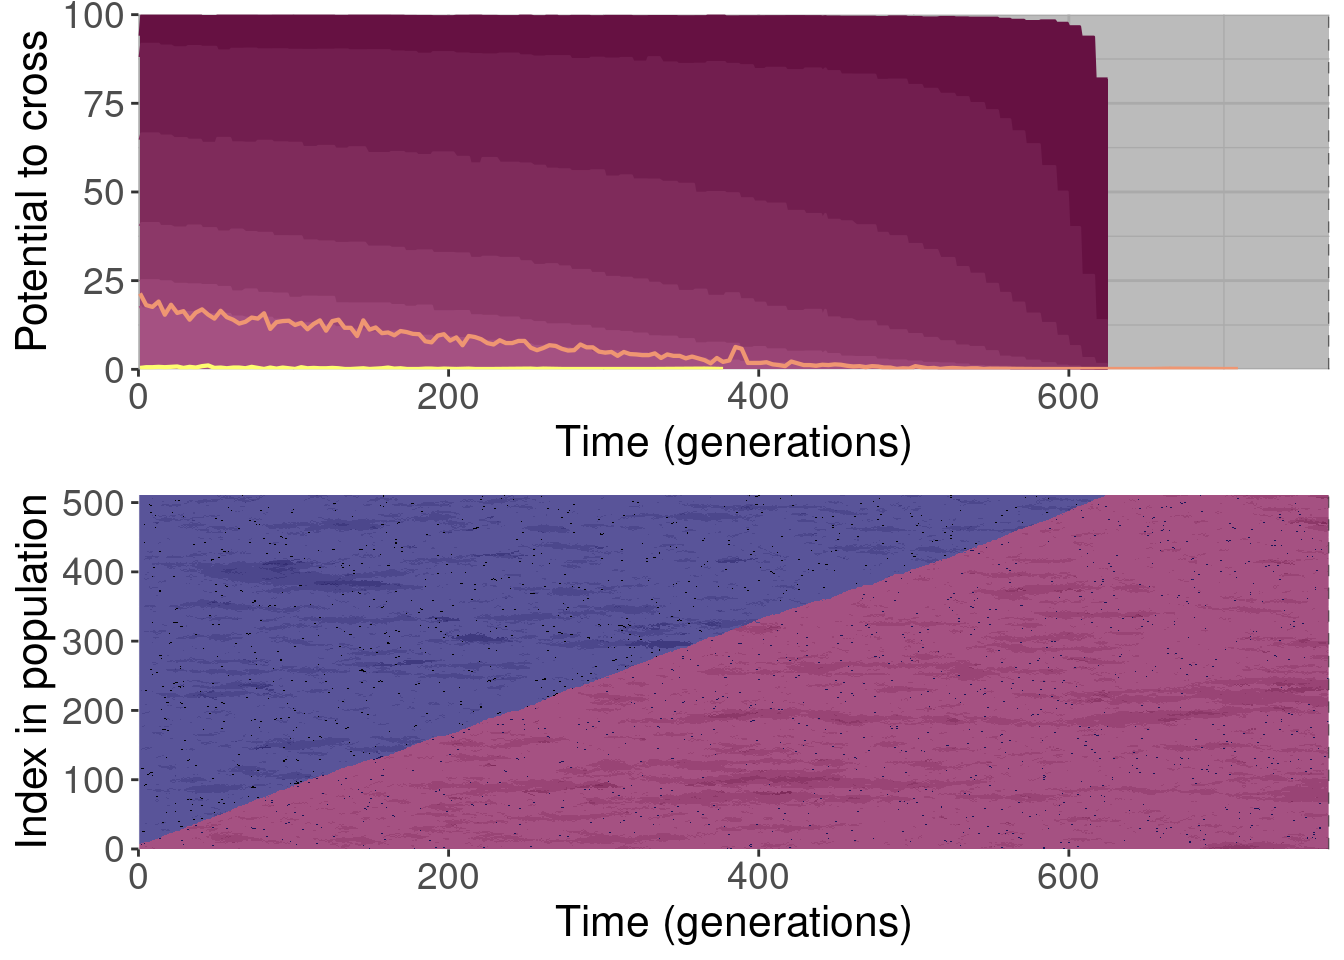
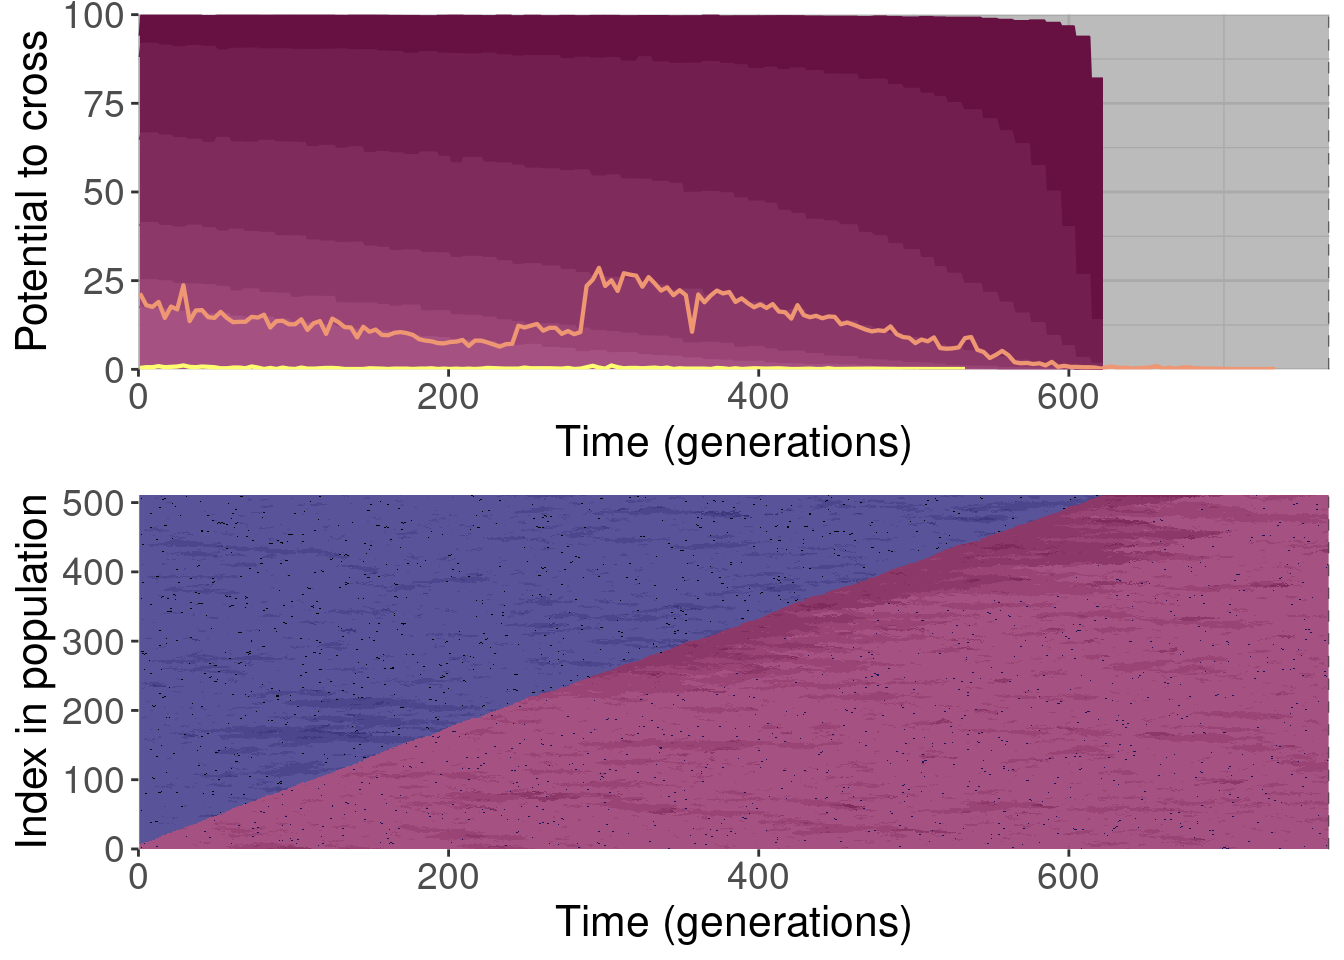
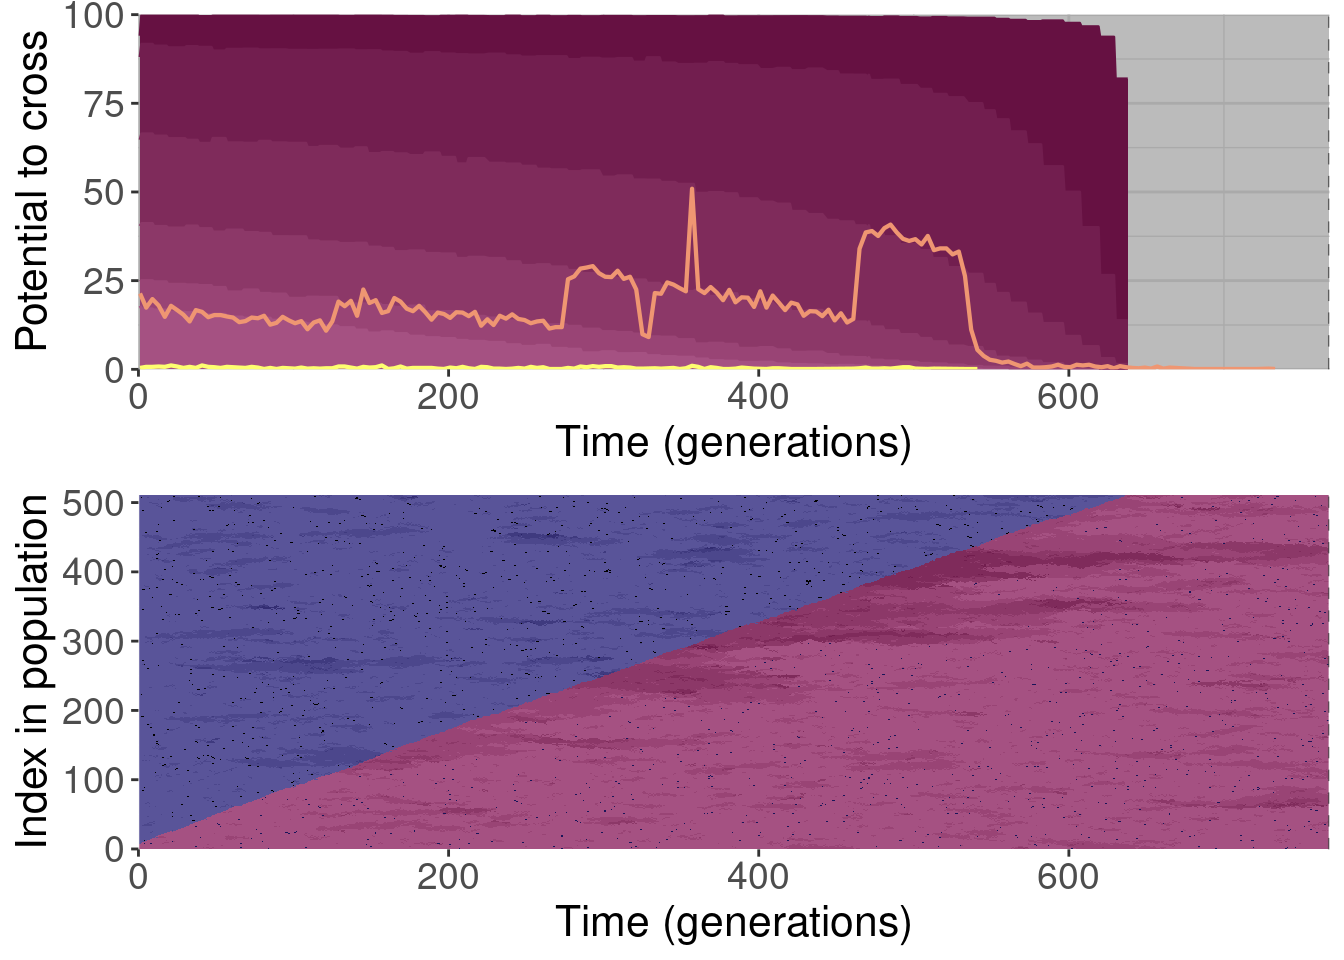
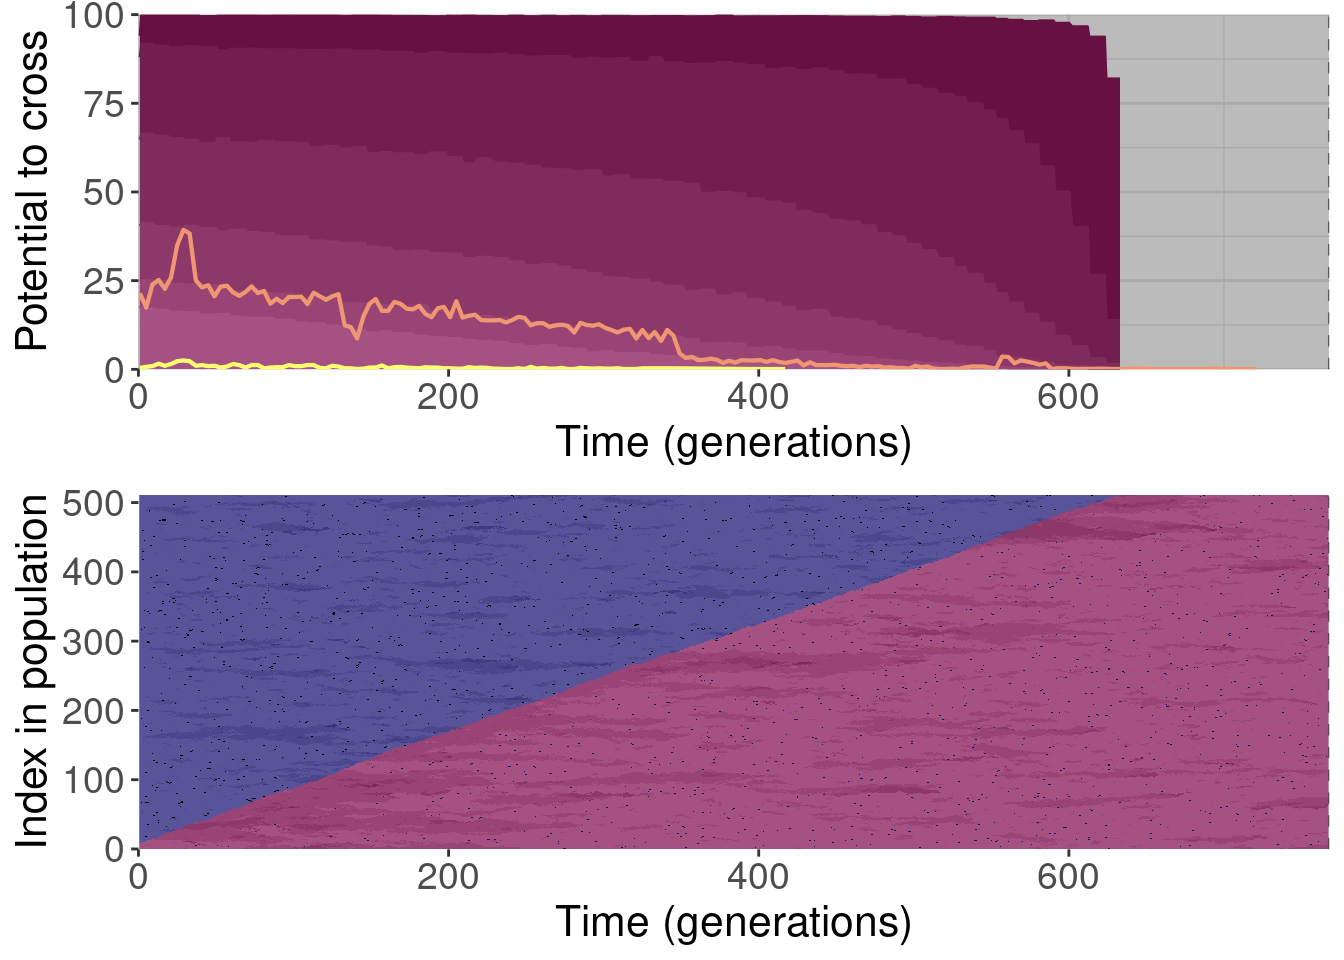
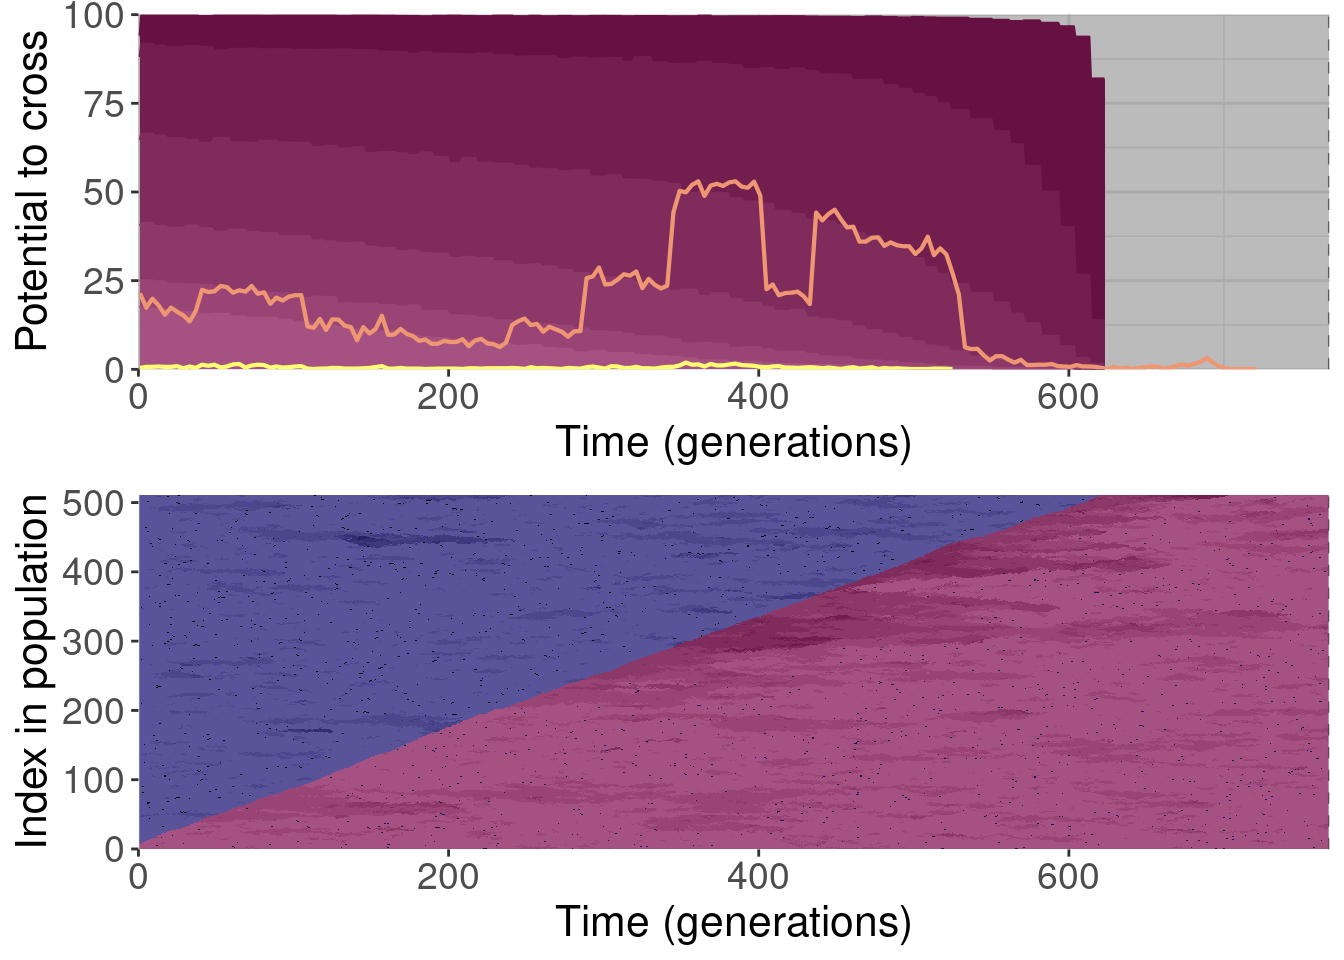
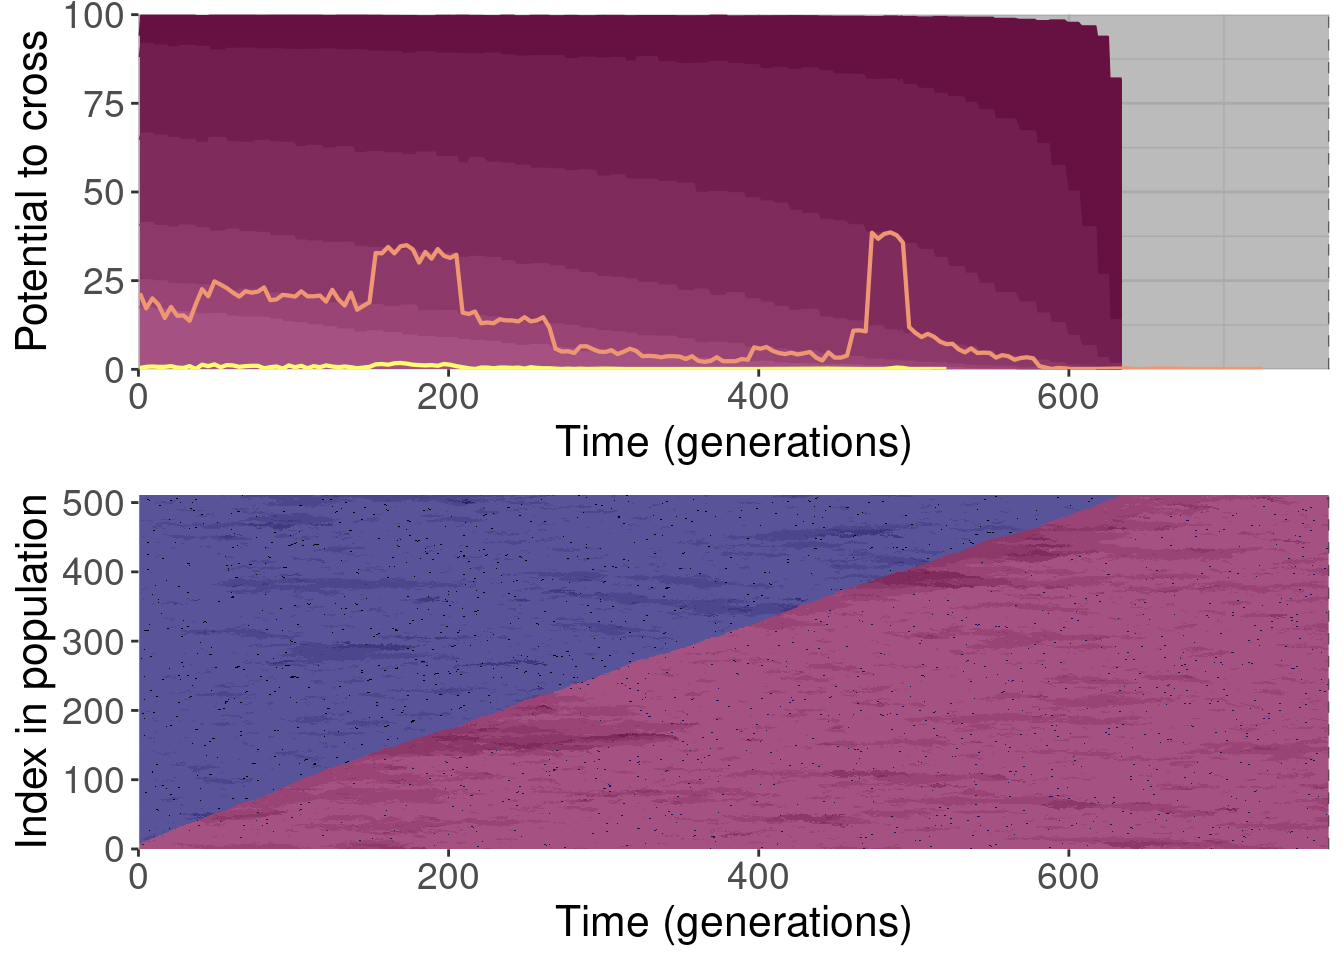
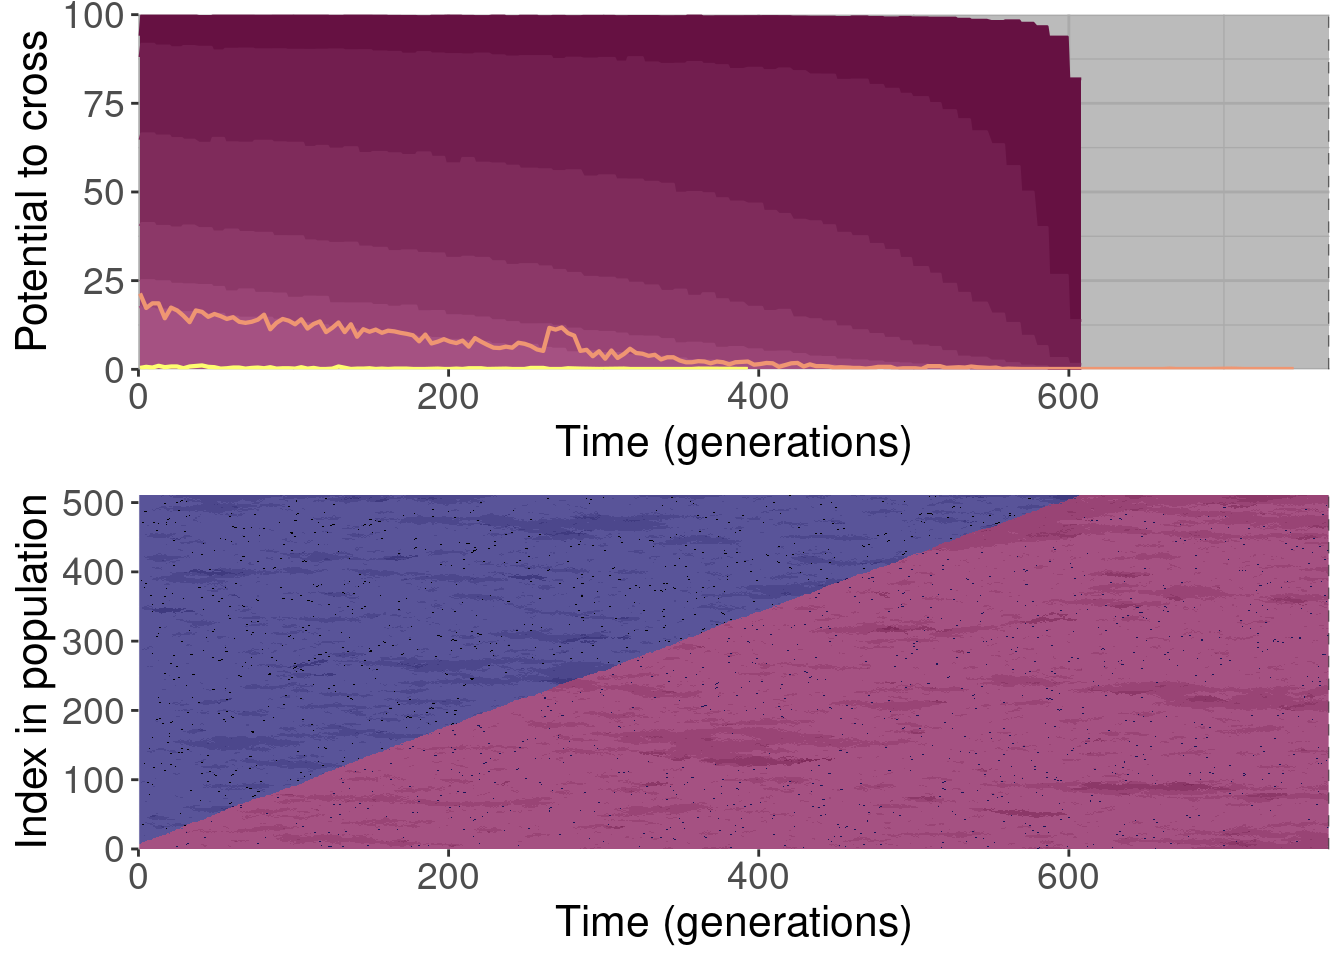
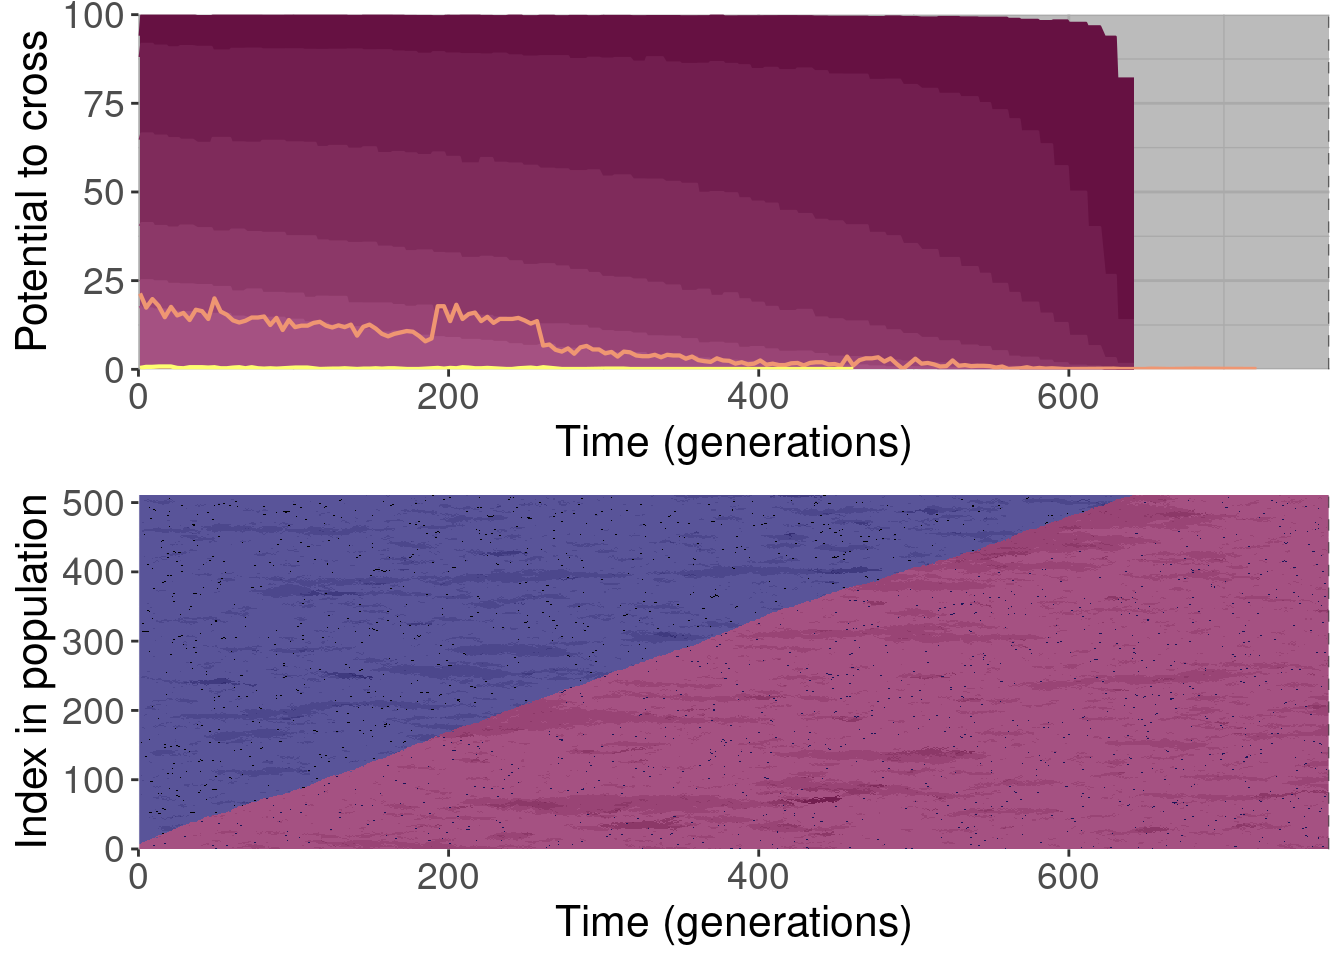
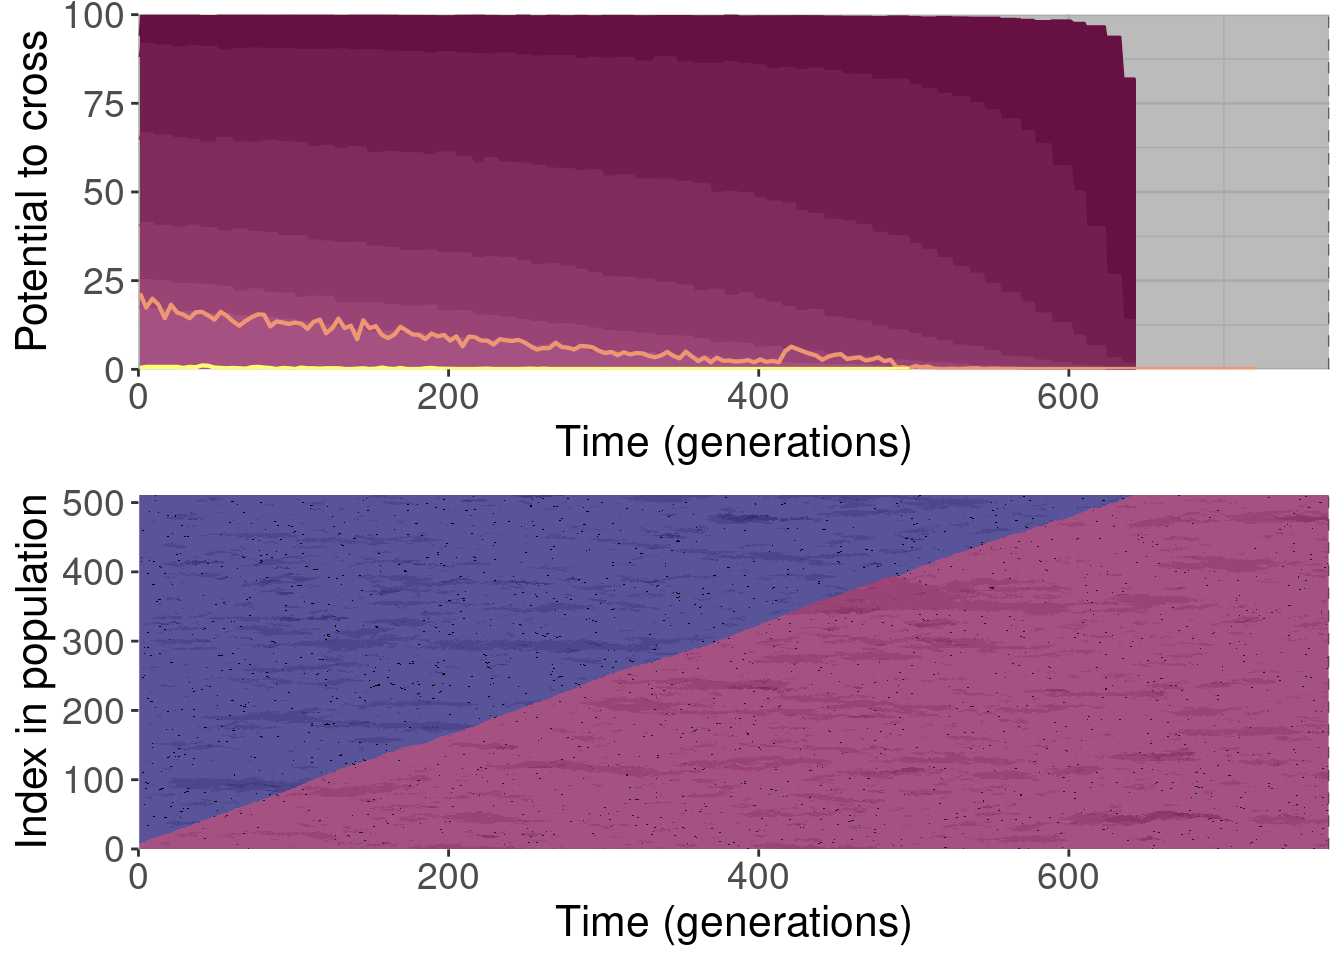
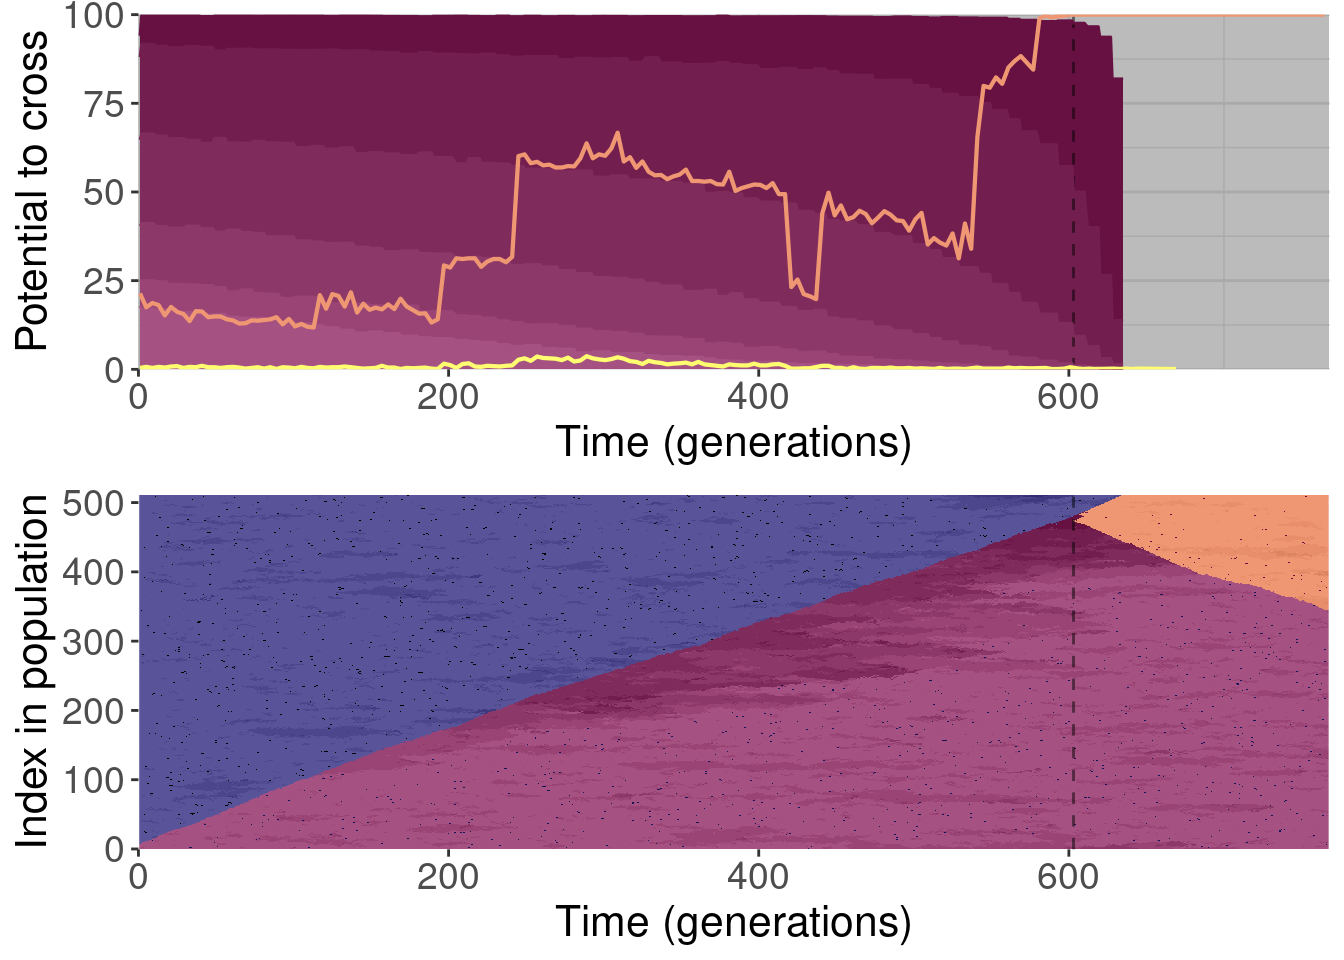
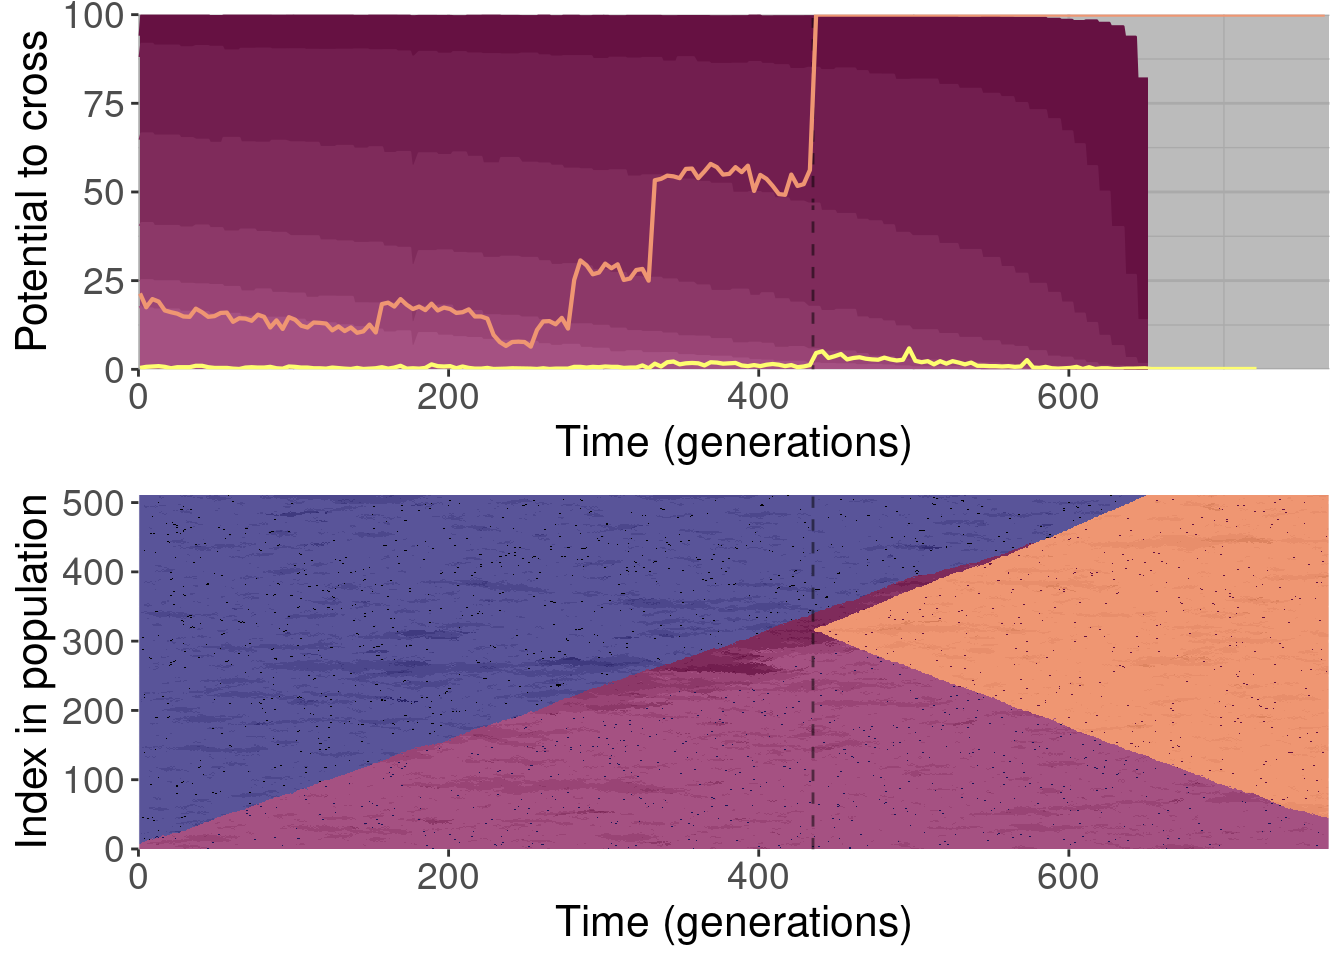
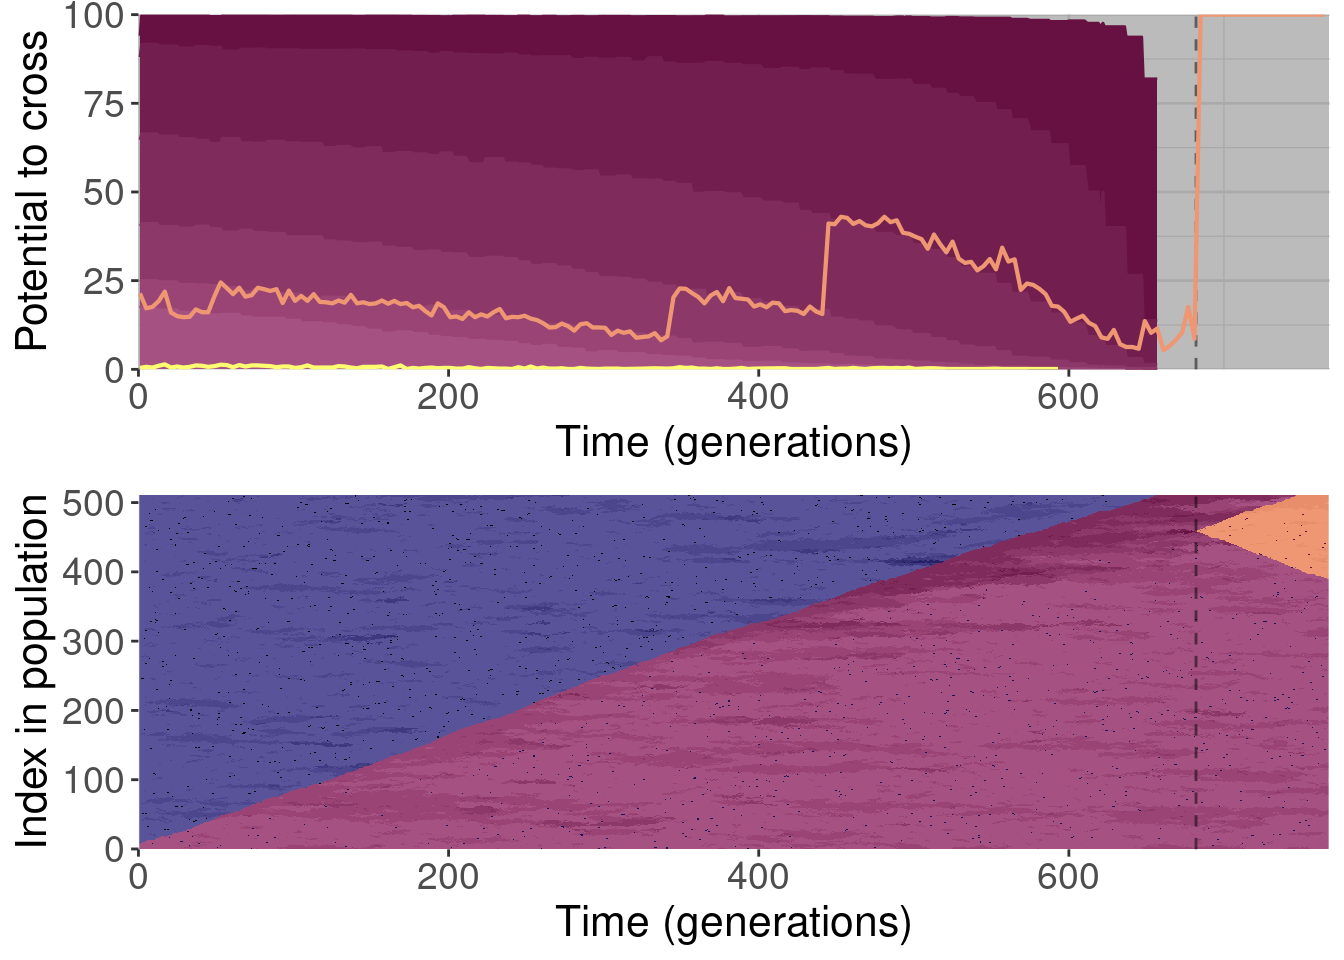
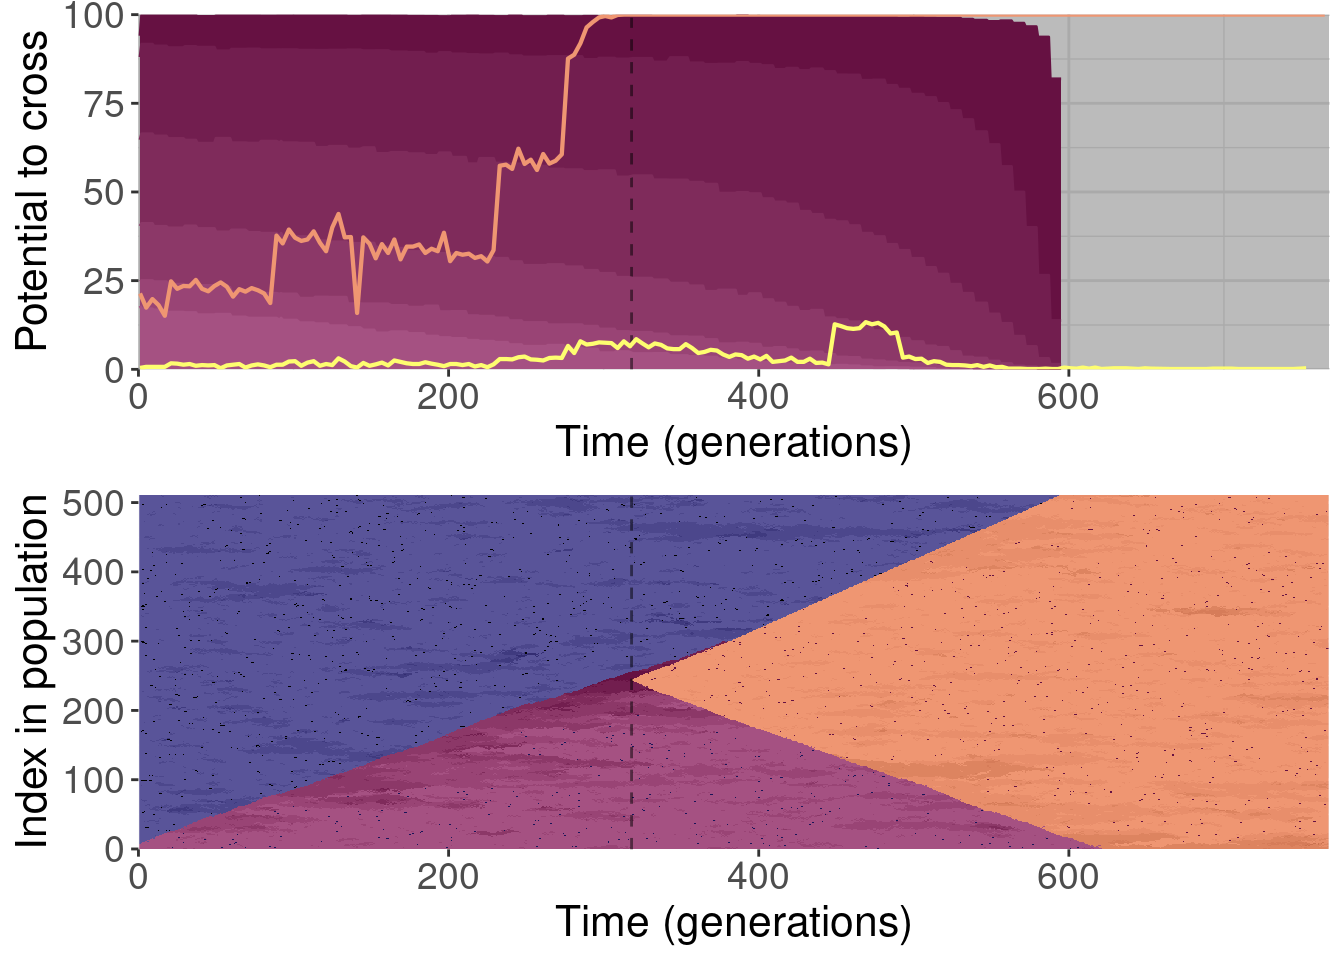
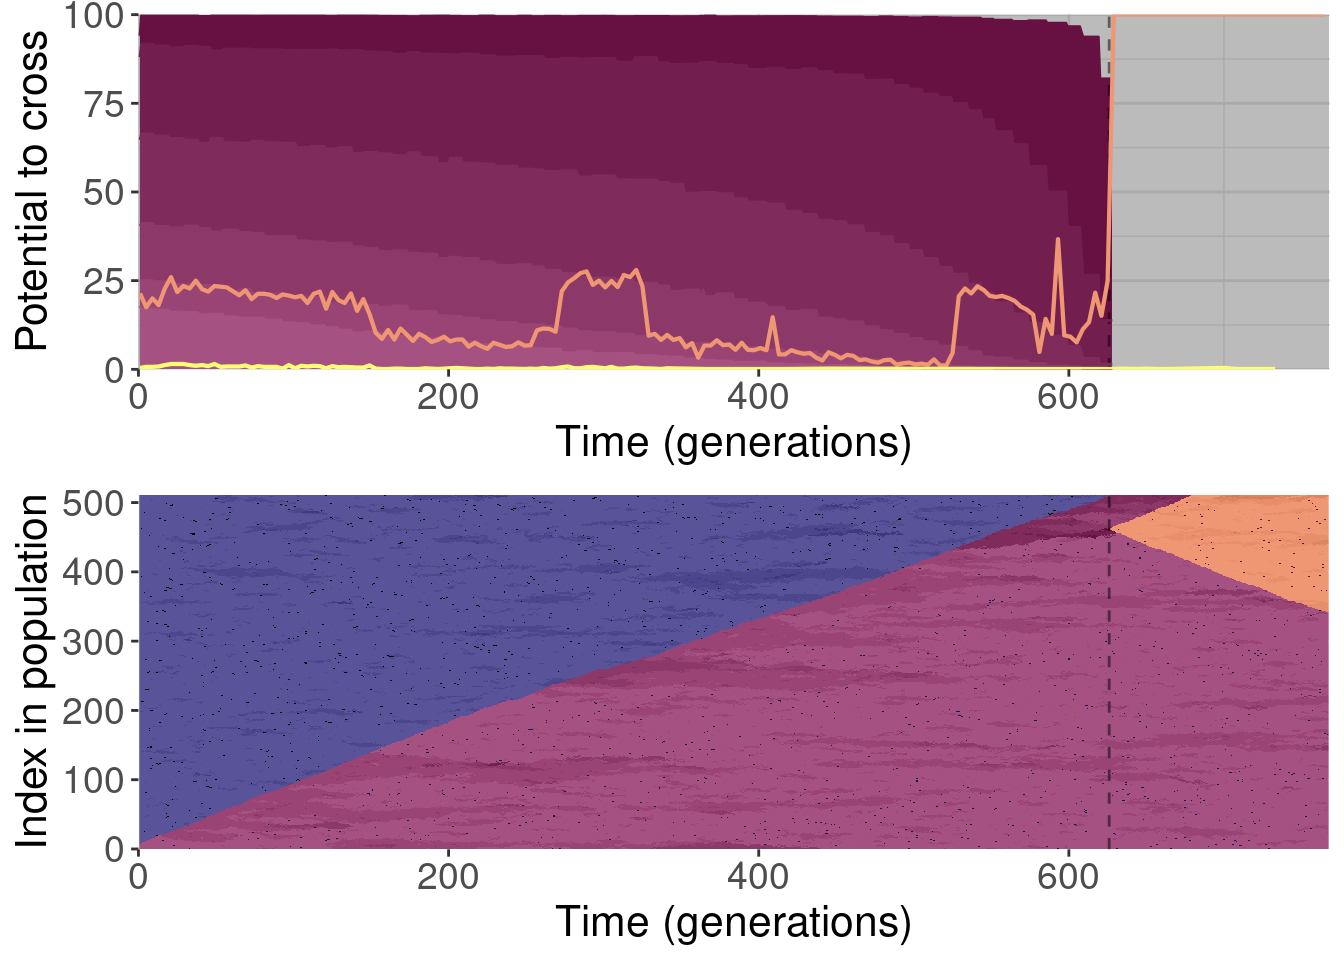
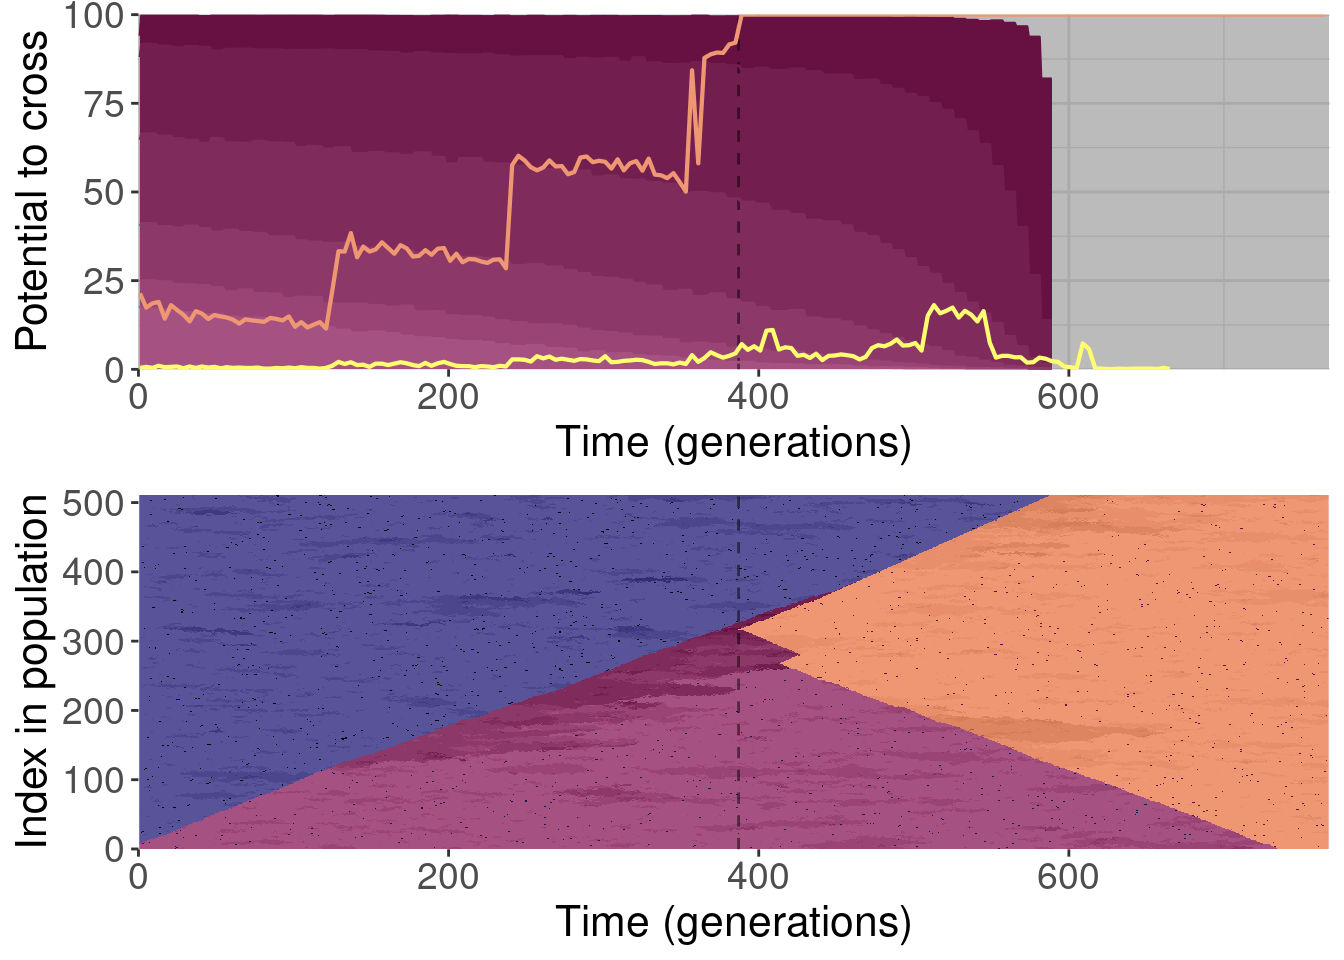
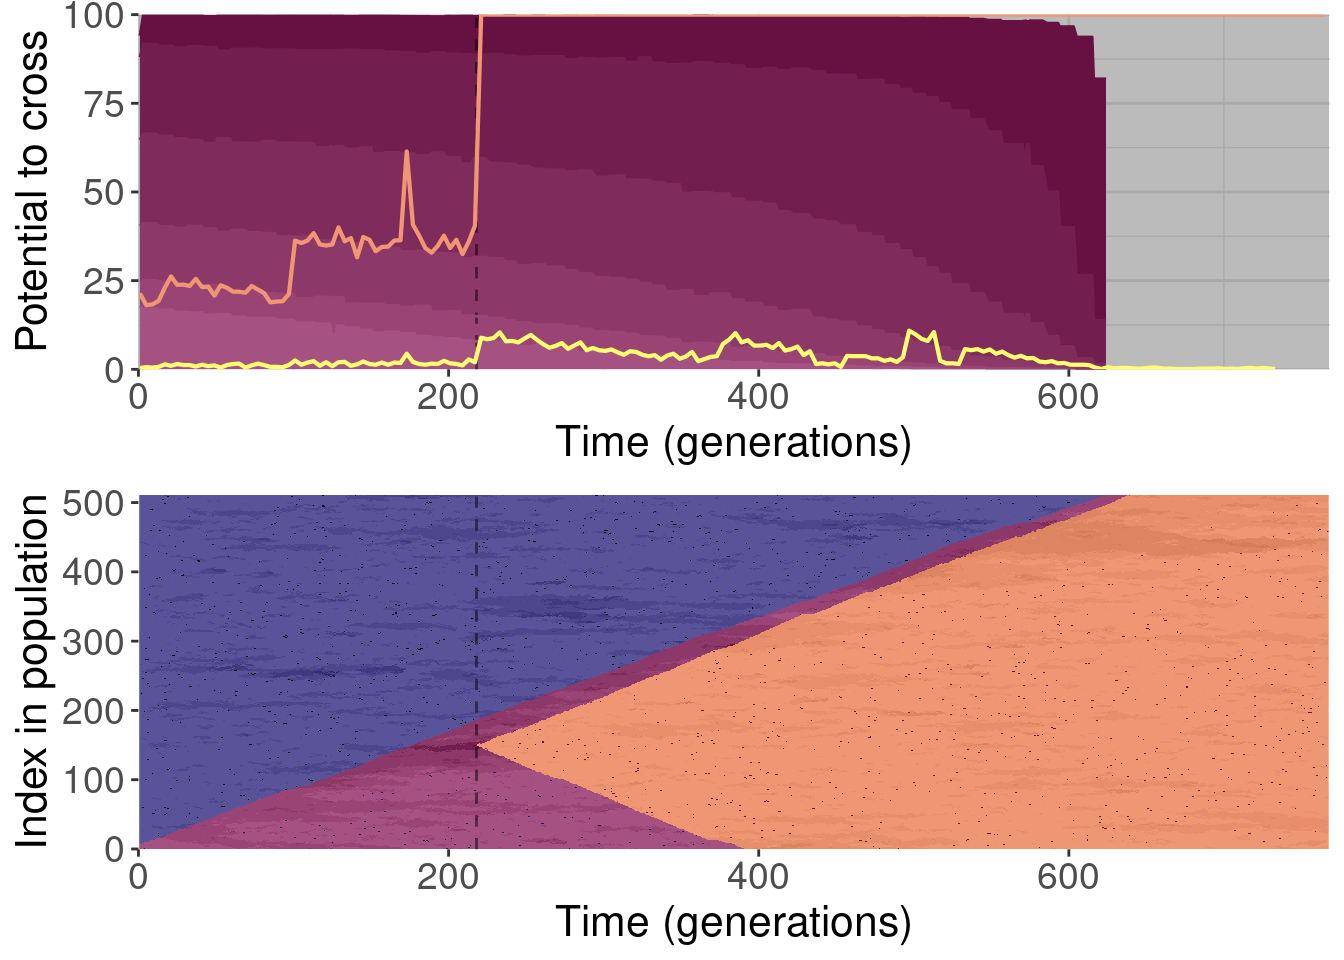
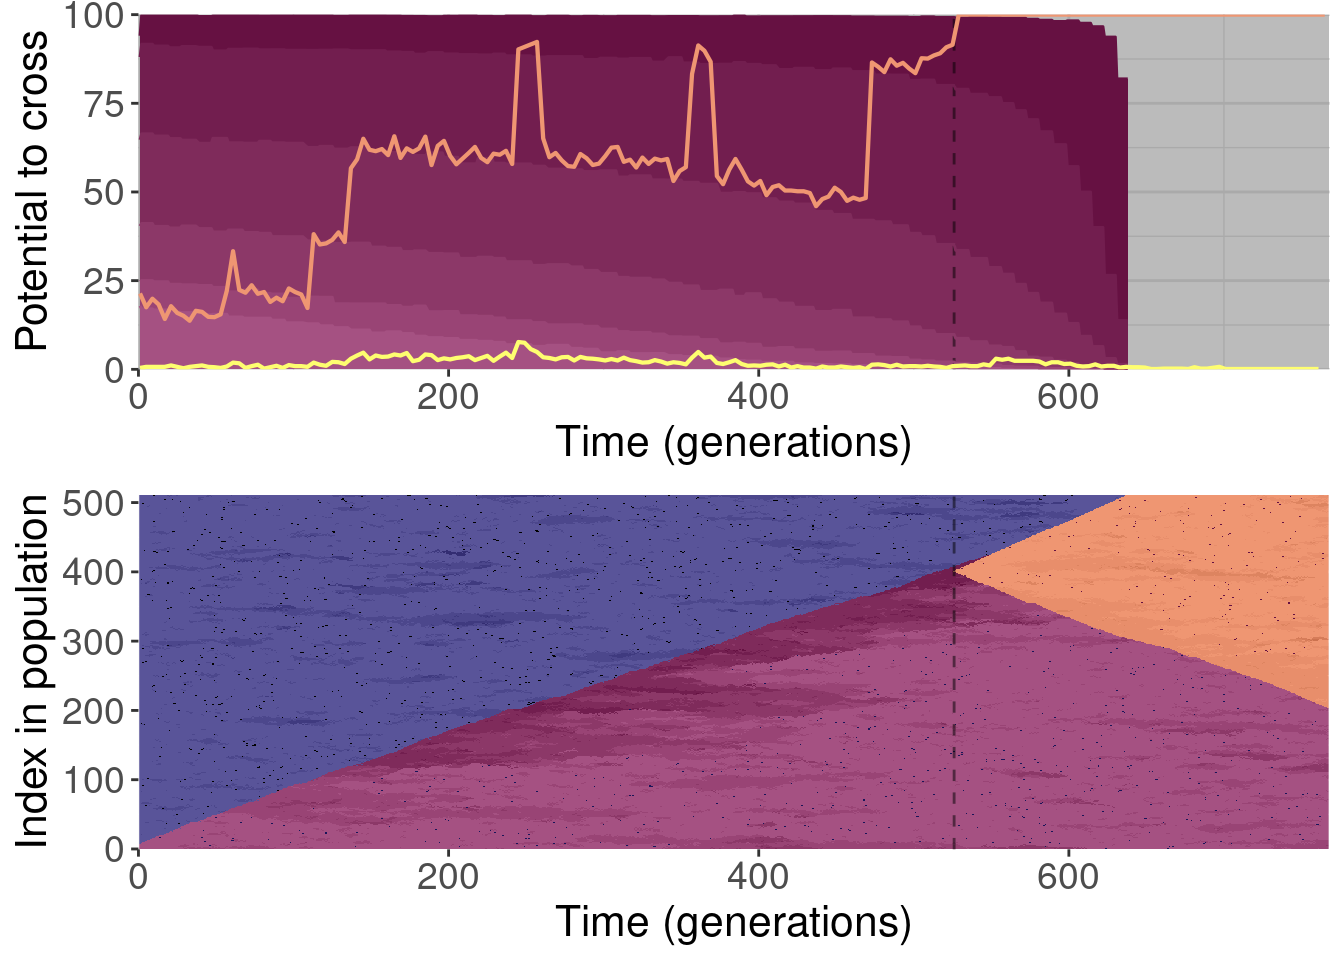
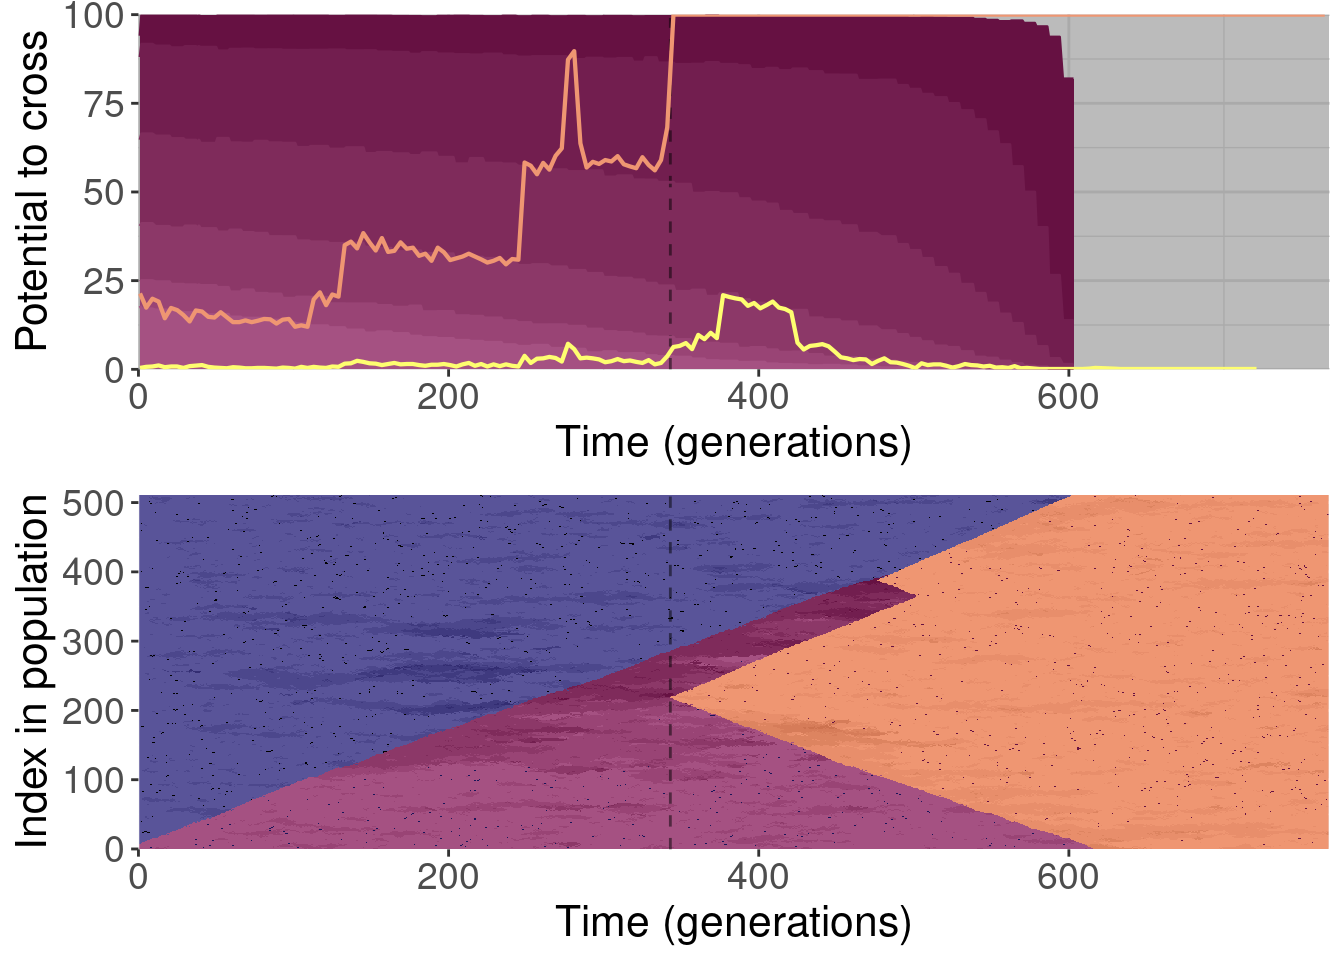
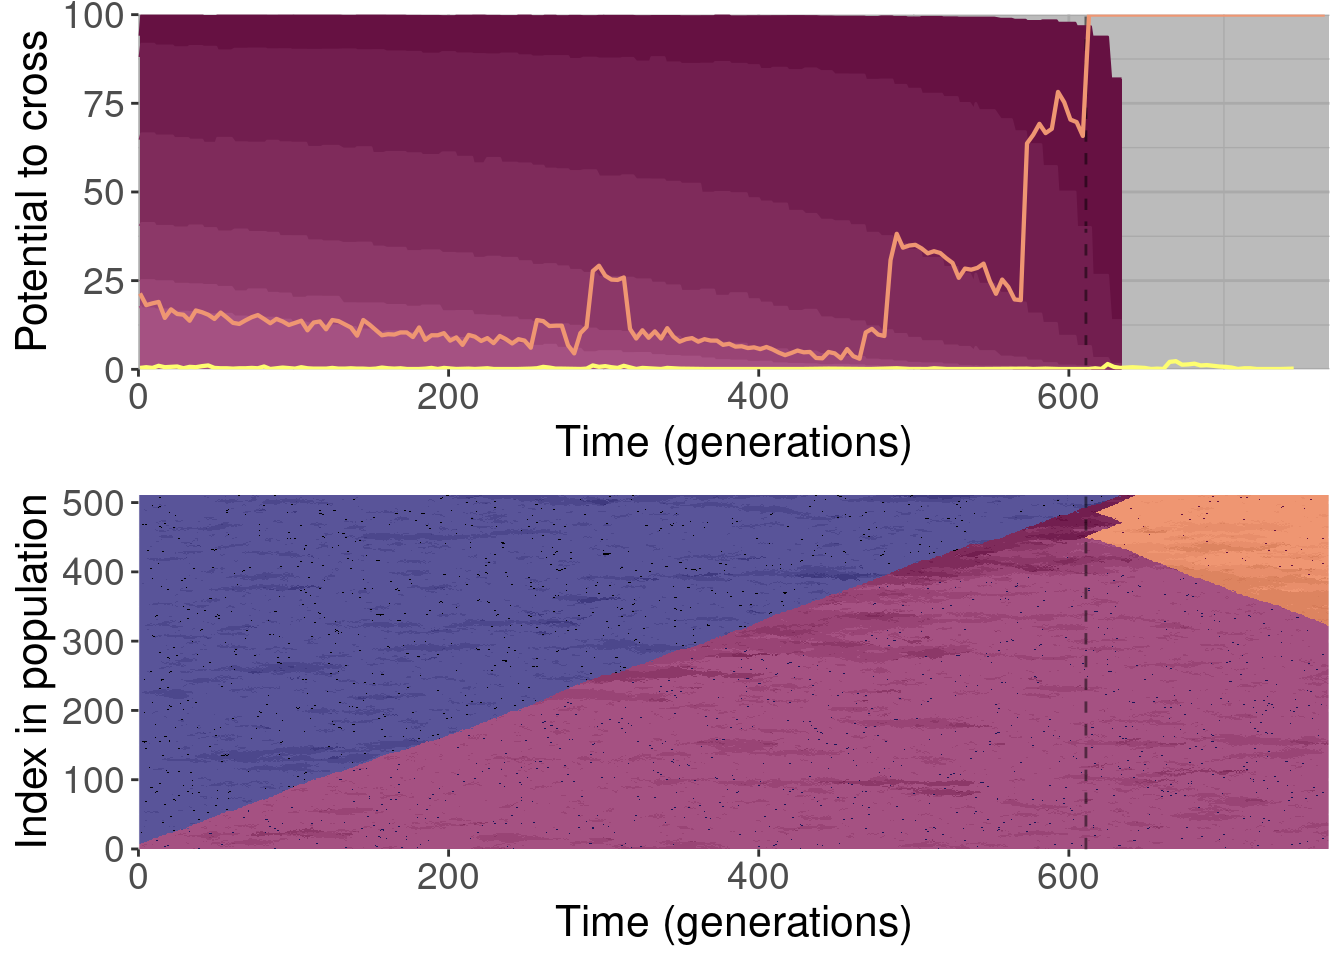
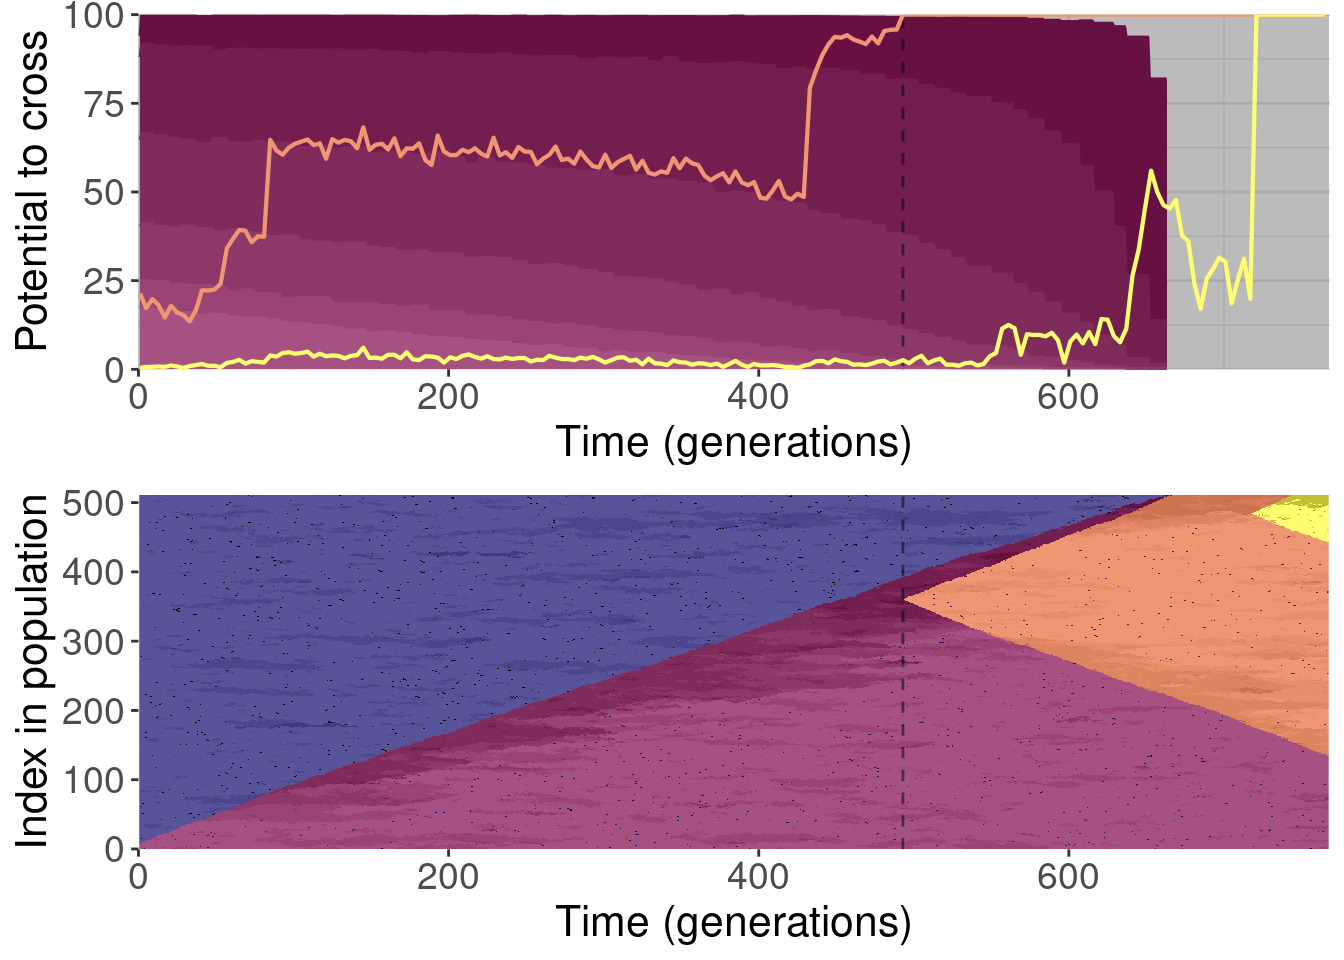
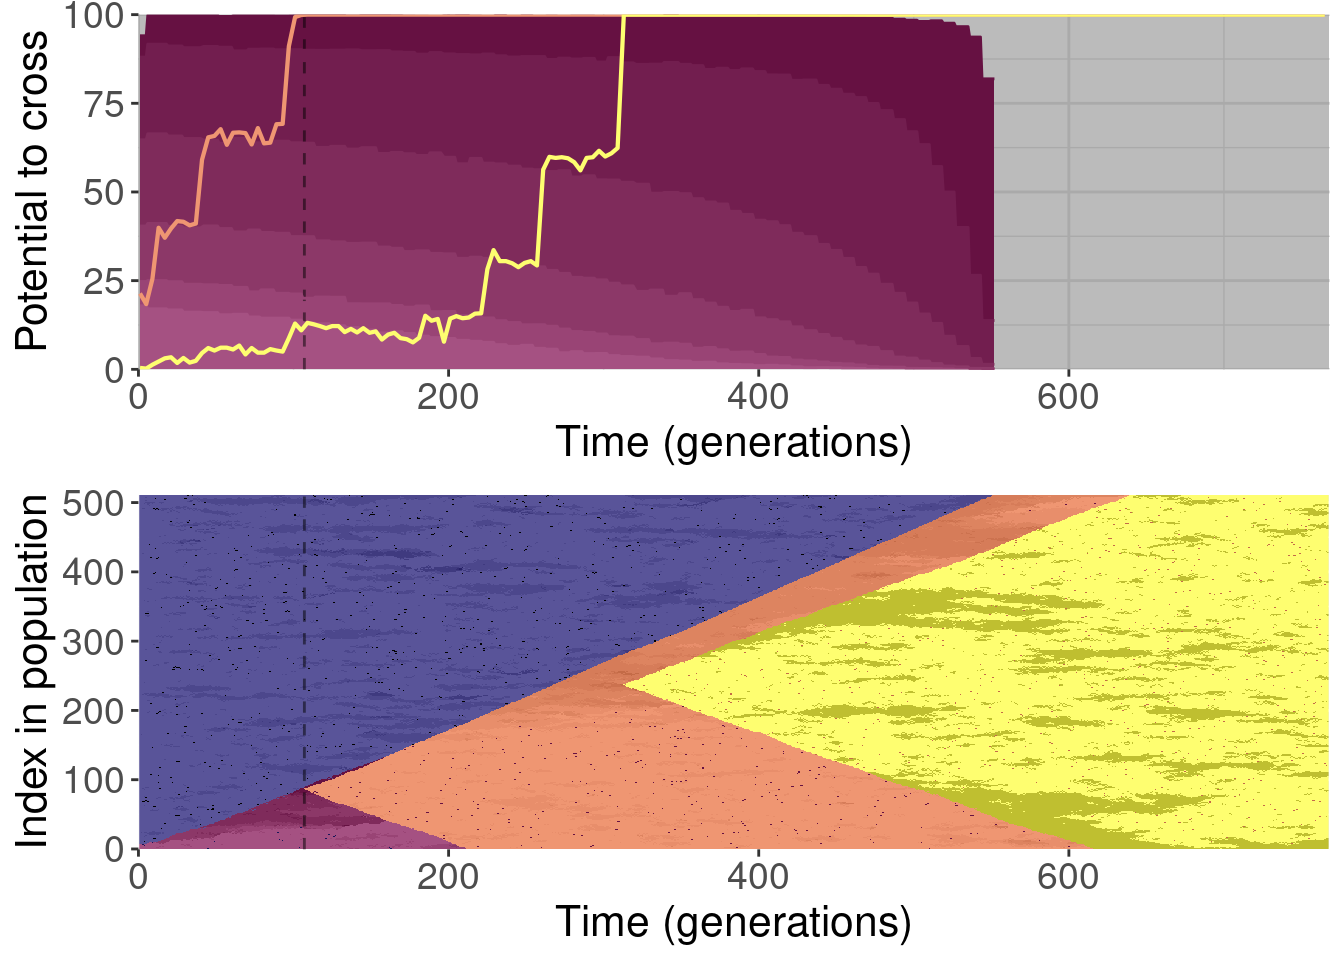
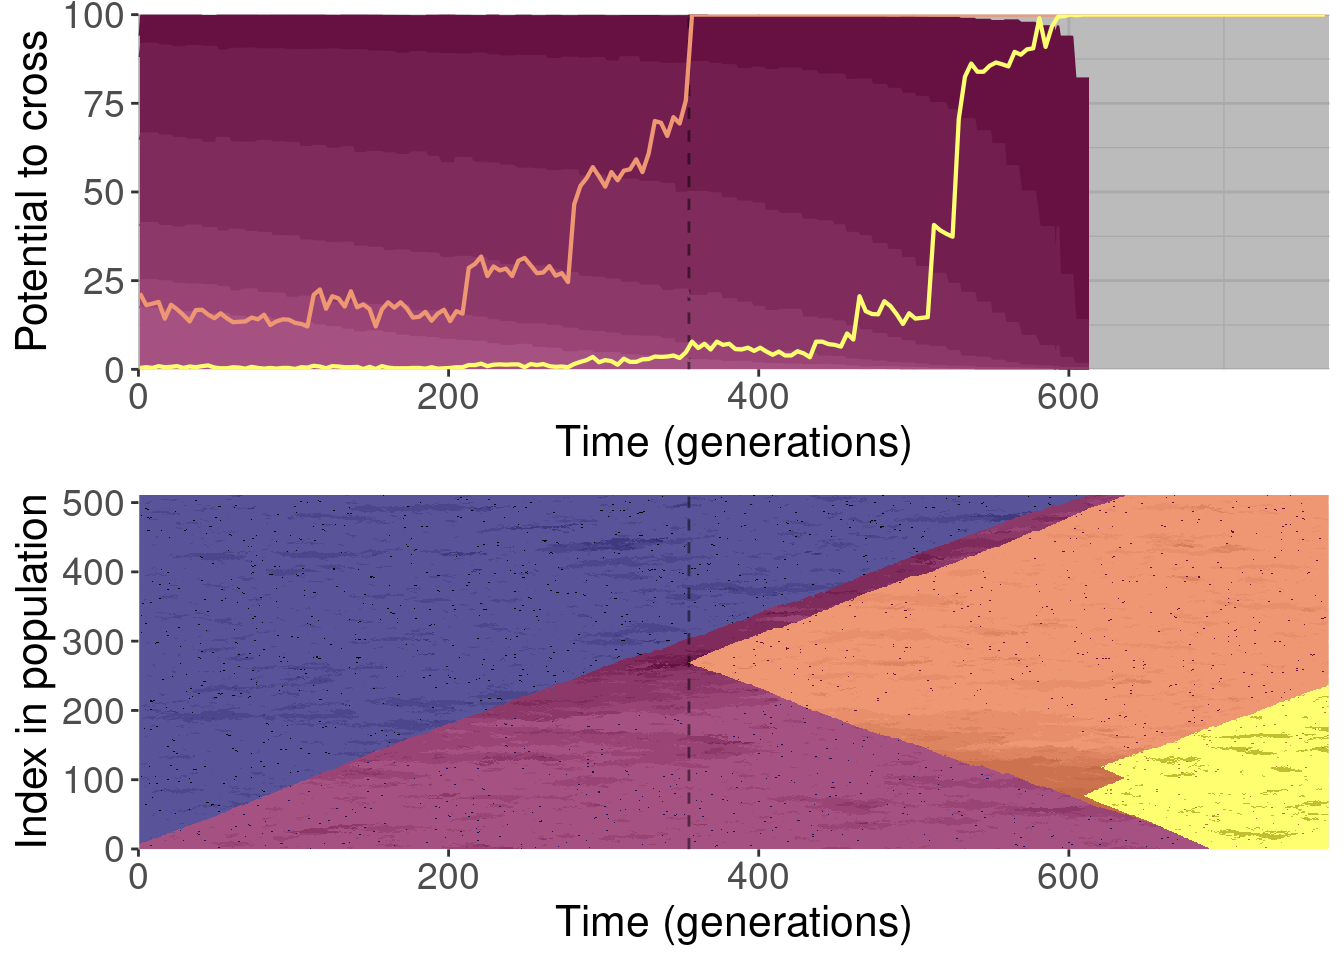
For each plot, the top subplot shows the potential to cross the first valley (orange line) and the second valley (yellow line).
The background of the top subplot shows the expectation based on the position of the leading edge, as in the paper.
The bottom subplot shows the state of the population at each generation of the original replicate.
Dependencies
# External
library(ggplot2)
library(dplyr)
library(cowplot)

base_repo_dir = '../..'
exp_dir = paste0(base_repo_dir, '/experiments/2024_03_18_01__replays/')

# Internal
source(paste0(base_repo_dir, '/global_shared_files/global_analysis_variables.R'))
Populations that did not cross
Seed 134
plot_replay_with_adjusted_benchmark('134')
Seed 158
plot_replay_with_adjusted_benchmark('158')
Seed 164
plot_replay_with_adjusted_benchmark('164')

Seed 175
plot_replay_with_adjusted_benchmark('175')
Seed 252
plot_replay_with_adjusted_benchmark('252')
Seed 339
Note that this is the seed in Figure 6 of the paper.
plot_replay_with_adjusted_benchmark('339')
Seed 365
plot_replay_with_adjusted_benchmark('365')
Seed 394
plot_replay_with_adjusted_benchmark('394')
Seed 446
plot_replay_with_adjusted_benchmark('446')
Seed 450
plot_replay_with_adjusted_benchmark('450')
Populations that crossed once
Seed 011
plot_replay_with_adjusted_benchmark('011')
Seed 050
plot_replay_with_adjusted_benchmark('050')
Seed 075
plot_replay_with_adjusted_benchmark('075')
Seed 083
plot_replay_with_adjusted_benchmark('083')
Seed 105
plot_replay_with_adjusted_benchmark('105')
Seed 282
plot_replay_with_adjusted_benchmark('282')
Seed 343
plot_replay_with_adjusted_benchmark('343')
Seed 400
Note that this is the seed in Figure 4 of the paper.
plot_replay_with_adjusted_benchmark('400')
Seed 408
plot_replay_with_adjusted_benchmark('408')
Seed 415
plot_replay_with_adjusted_benchmark('415')
Populations that crossed twice
Seed 093
plot_replay_with_adjusted_benchmark('093')
Seed 124
plot_replay_with_adjusted_benchmark('124')
Seed 138
plot_replay_with_adjusted_benchmark('138')
Seed 263
Note that this is the seed in Figure 5 of the paper.
plot_replay_with_adjusted_benchmark('263')